
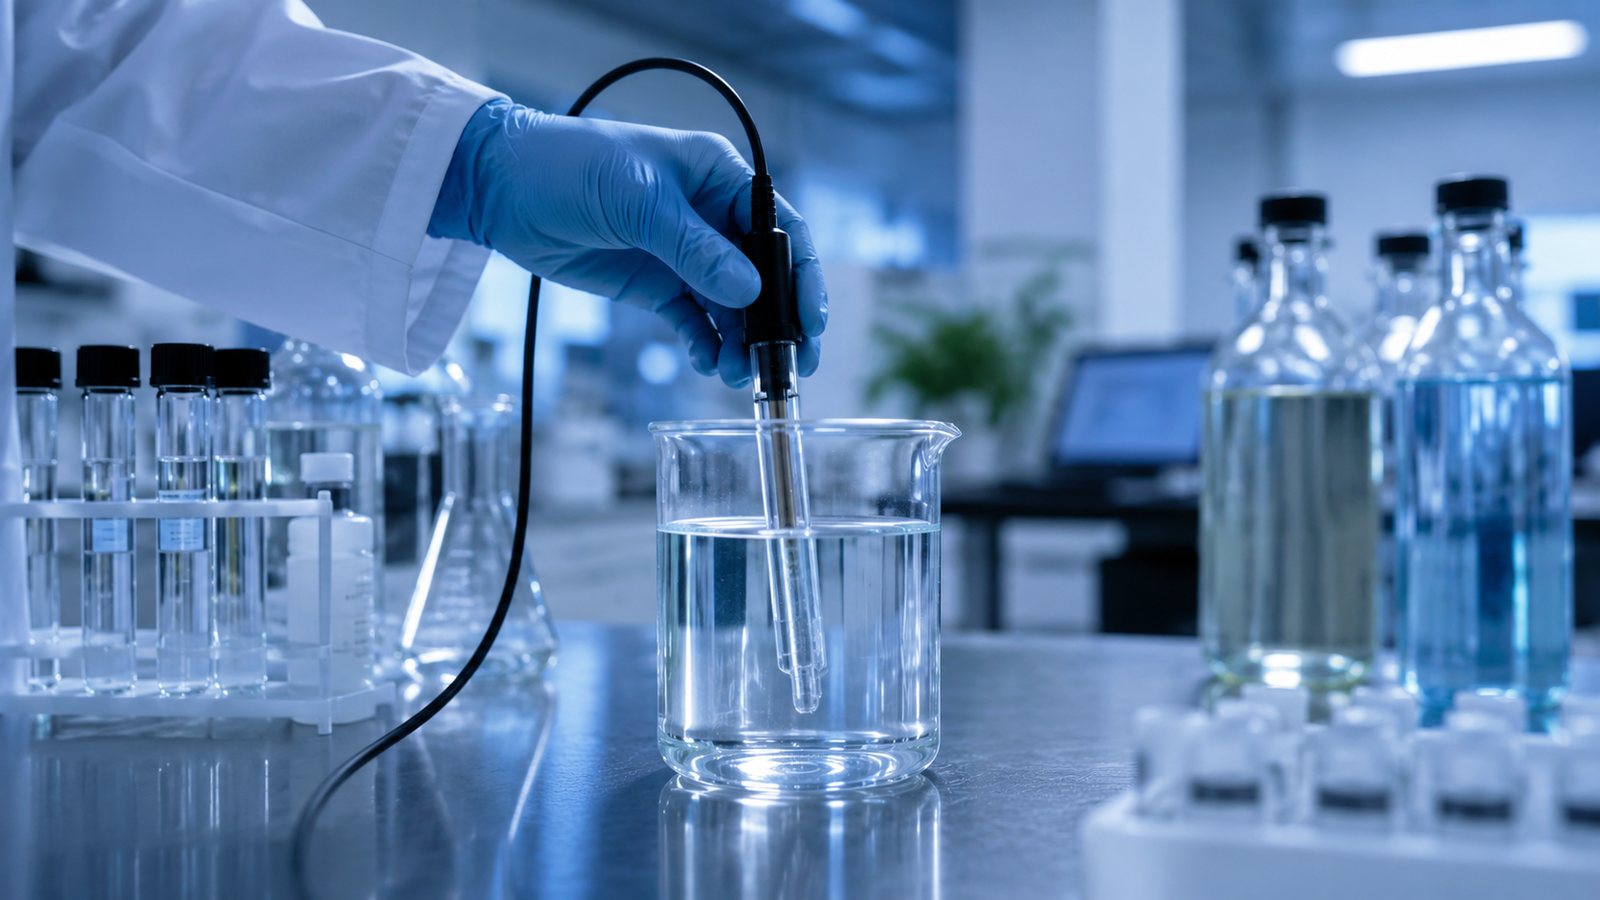
ORP Chart for Different Processes
Oxidation-reduction potential (ORP), measured in millivolts, is a practical control point for dosing. These are typical target ranges Jenfitch uses across treatment processes.
Approved, certified & independently validated
 EPA FIFRA
Registered
 USDA Organic
Certified
 NSF/ANSI
Standard 60
What is ORP?
Why we control by millivolts, not just ppm.
Oxidation-reduction potential (ORP) is a direct measurement, in millivolts, of a solution's oxidizing power — its actual ability to inactivate organisms and break down contaminants. That is the number that matters. Disinfection efficacy tracks ORP, not simply the concentration of chemical added: the same free-chlorine dose can be far more or far less effective depending on pH, because pH shifts how much of the chlorine exists as the active, high-ORP species.
Dosing to a target ORP therefore closes the loop between chemical fed and disinfection actually achieved. Higher ORP means fewer surviving organisms. For a disinfection barrier, Jenfitch targets +650 to +750 mV; at +700 mV, JC 9465 delivers a 6-log kill in under 10 seconds.
ppm can mislead; ORP does not
Because free-chlorine kill efficacy is pH-dependent, a fixed ppm setpoint can leave a system under- or over-treated as pH drifts. An ORP setpoint measures the result directly and holds it steady.
Reference Ranges
Target ORP by process (mV).
Ranges are typical reference targets and should be confirmed for your specific water chemistry and application.
Benchmark
ORP vs. surviving organisms.
| ORP (mV) | Surviving CFU / 100 mL | Status |
|---|---|---|
| +200 | 300 | Poor control |
| +300 | 36 | Partial |
| +400 | 3 | Improving |
| +600 | 0 | Disinfection |
| +700 | 0 | 6-log kill in <10 sec |
| +800 | 0 | Sterilization |
Questions
Common questions — ORP
Why control by ORP instead of ppm?
ORP measures oxidizing power directly — the actual disinfection result. Free-chlorine efficacy is pH-dependent, so a fixed ppm dose can leave a system over- or under-treated as pH drifts. An ORP setpoint holds the result steady.
What ORP do I need for disinfection?
A disinfection barrier is typically +650 to +750 mV. At +700 mV, JC 9465 achieves a 6-log kill in under 10 seconds; +600 mV corresponds to zero surviving CFU in the benchmark, and +800 mV to sterilization.
How does pH fit in?
pH governs the balance between active and inactive chlorine species, so it directly affects ORP at a given ppm. The Free Chlorine vs ORP/mV vs pH chart below shows this relationship — and is why measuring ORP is more reliable than measuring dose alone.
Charts & Documents